VM inventory, metrics, and configuration validation
The methods on this page change nothing. They answer four questions: which VMs exist in the cluster, how a particular VM is configured, what has happened to it, and how it is doing now. Configuration validation is separate: it compares the running VM with the authoritative configuration maintained by vStack Center.
All methods have the same visibility scope: the Cluster master role sees the entire cluster; other users see only VMs in the VDCs (virtual data centers) where they have assigned roles.
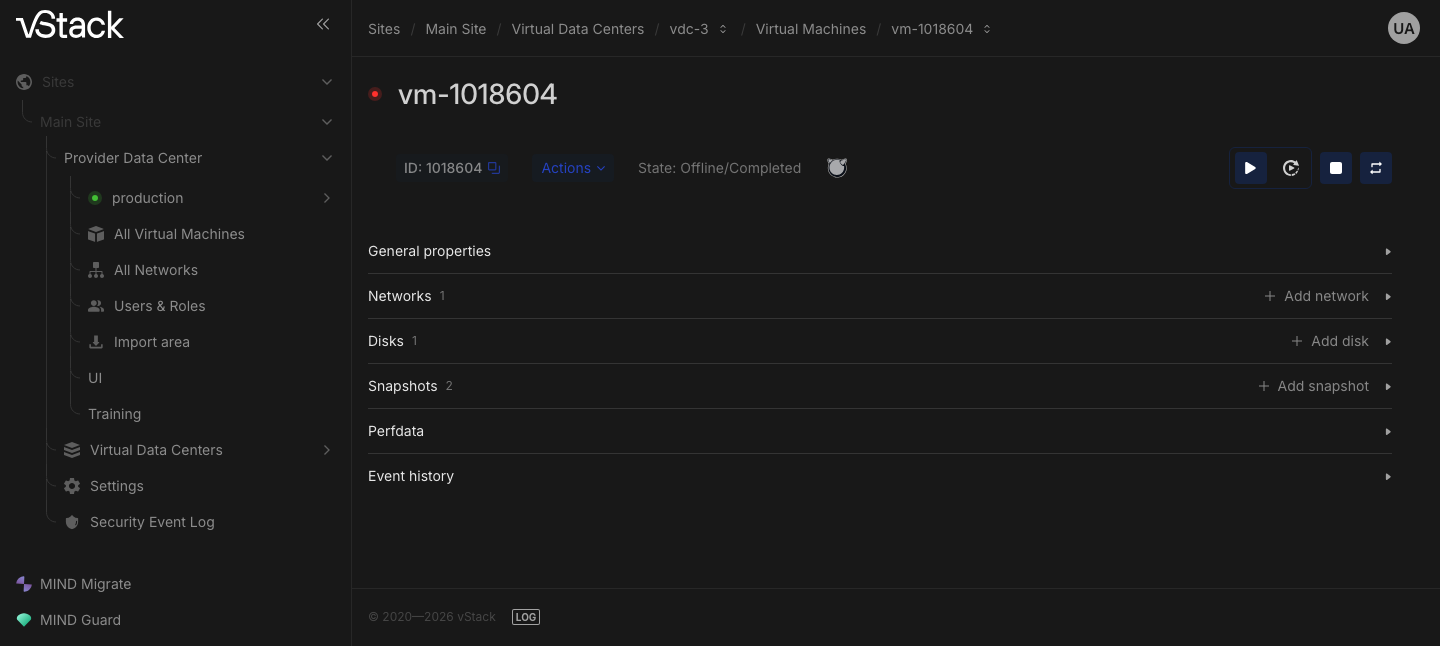
In the web interface, the same data appears in the All Virtual Machines list with ID, Name, IP, OS, State, Health, vCPU class, CPU (Cores), RAM (GB), and Storage (GB) columns, Search in table search, and CSV export. The VM card has a Perfdata section with CPU, Disks, Networks, and Memory toggles, and an Event history section with ID, Action, Method, Status, Report, Start Time, End time, and Duration s columns.
vm-list
VM list. Access:
- Cluster master: all VMs in the cluster; the response includes the additional
nodeandrstartfields. - An ordinary user: only VMs in VDCs where they have assigned roles;
nodeandrstartare not returned.
Each VM appears in the response exactly once. Before 3.2.0, a VM appeared as many times as the user had roles in its VDC, so external systems building inventories from this list received duplicates. The fix did not change which VMs the list contains; it only removed duplicates.
| Parameter | Type | Required | Description |
|---|---|---|---|
objective | Any | No | If the field is present with any value, the response is a map keyed by vm_id instead of an array |
vdc | Number | No | Filter by VDC; minimum 1 |
{
  "jsonrpc": "2.0",
  "method": "vm-list",
  "params": {},
  "id": "cbf4478c-84b5-45ac-97cd-0390d7190585"
}
{
  "jsonrpc": "2.0",
  "id": "cbf4478c-84b5-45ac-97cd-0390d7190585",
  "result": {
    "code": 1,
    "data": [
      {
        "vdc_id": 2,
        "vm_id": 1,
        "vm_name": "vm-1",
        "vm_status": 3,
        "admin_status": 1,
        "oper_status": 3,
        "oper_status_ts": 1700000000,
        "os_type": 1,
        "os_profile": "8f14e45f-ceea-467a-9c1e-2d3b7a0f5c61",
        "cpu_count": 2,
        "memory_count": 1073741824,
        "hw_version": 3,
        "locked": 1,
        "create_completed": 1,
        "nvme": true,
        "storage_provisioned": 10737418240,
        "address": "192.0.2.1",
        "address_v6": ["2001:db8::10", "2001:db8::11"],
        "pool": "1000",
        "vcpu_class": 1,
        "service": 0,
        "GI_object": 0,
        "modified": 1700000000,
        "incarnation": 17000000000,
        "node": 5,
        "rstart": 0
      }
    ]
  }
}
Field details: address is the IPv4 address of the first port (by lowest slot),
or null if no IPv4 address is assigned; address_v6 is the IPv6 array for
that same port, or an empty array if there are no addresses; nvme indicates
the disk mode and thus determines where the VM can start.
Error: -7 means the list could not be read.
vm-get
The full VM card by identifier: main fields, network_ports and disks arrays,
the hv_faults object, and, if metrics are available, a guest object with
memory usage.
| Parameter | Type | Required | Description |
|---|---|---|---|
id | Number | Yes | VM identifier; minimum 1 |
{
  "jsonrpc": "2.0",
  "method": "vm-get",
  "params": { "id": 42 },
  "id": "cbf4478c-84b5-45ac-97cd-0390d7190585"
}
Response excerpt with devices:
{
  "jsonrpc": "2.0",
  "id": "cbf4478c-84b5-45ac-97cd-0390d7190585",
  "result": {
    "code": 1,
    "data": {
      "id": 42,
      "name": "vm-42",
      "cpus": 2,
      "ram": 1073741824,
      "hw_version": 4,
      "status": 3,
      "admin_status": 1,
      "oper_status": 3,
      "oper_status_ts": 1700000050,
      "locked": 0,
      "create_completed": 1,
      "nvme": true,
      "node": 3,
      "pool": "123456789",
      "root_dataset_name": "z01/.vm_V4/000000042",
      "vdc": 5,
      "network_ports": [
        {
          "network_id": 100,
          "port_id": 1,
          "address": "192.0.2.5",
          "address_v6": ["2001:db8::10"],
          "mac": "00:11:22:33:44:55",
          "ip_guard": 1,
          "mac_guard": 0,
          "ratelimit_mbits": 1000,
          "slot": 14
        }
      ],
      "disks": [
        {
          "guid": "111222333",
          "label": "data-disk",
          "size": 10737418240,
          "slot": 1,
          "iops_limit": 5000,
          "mbps_limit": 200,
          "sector_size": { "logical": 512, "physical": 4096 },
          "pool_name": "z01"
        }
      ],
      "guest": {
        "ram_used": 536870912,
        "ram_balloon_requested": null,
        "ram_balloon_performed": null
      }
    }
  }
}
Format details relevant to API clients:
os_profileis returned as a string containing the image UUID ornull. The short numeric image identifier was replaced with a UUID in 3.0.5; this is a declared breaking change.GI_object,locked,create_completed,ip_guard, andmac_guardare serialized as0,1, ornull.poolis a string;root_datasetis a number.- For a disk,
sector_size.logicaldefaults to512, andphysicalto4096. - The
guestobject is present when the metrics store is available, even if the values themselves arenull; if metrics are unavailable, the field is absent.
Errors: -78 means a read failure; -3001 means the VM was not found within
the caller's visibility scope.
vm-statuses
VM status reference: a code-to-name map. No parameters.
{
  "jsonrpc": "2.0",
  "method": "vm-statuses",
  "params": {},
  "id": "cbf4478c-84b5-45ac-97cd-0390d7190585"
}
Use it to interpret numeric statuses from vm-list and vm-get in a
specific cluster. Error: -7.
vm-history
History of status changes for one VM.
| Parameter | Type | Required | Default | Limit |
|---|---|---|---|---|
vm_id | Number | Yes | — | Minimum 1 |
lines | Number | No | 50000 | Allowed range 1..999 |
ts_start | Number | No | null | No earlier than 1531924200 |
ts_finish | Number | No | null | No earlier than 1531924200, no later than 2222222222, greater than ts_start |
{
  "jsonrpc": "2.0",
  "method": "vm-history",
  "params": {
    "vm_id": 42,
    "lines": 100,
    "ts_start": 1700000000,
    "ts_finish": 1700100000
  },
  "id": "cbf4478c-84b5-45ac-97cd-0390d7190585"
}
{
  "jsonrpc": "2.0",
  "id": "cbf4478c-84b5-45ac-97cd-0390d7190585",
  "result": {
    "code": 1,
    "data": [
      { "ts": 1700000000, "ts_nano": 1700000000000000, "status": 3, "progress": 100 },
      { "ts": 1700000100, "ts_nano": 1700000100000000, "status": 5, "progress": 0 }
    ]
  }
}
Time filtering works only when both range parameters are supplied. Without
a range, the most recent records are returned, limited by lines.
Errors: -9305 means lines is out of range; -9320 and -9325 mean the
range boundaries are too old; -9326 means the upper boundary is too large;
-9327 means ts_finish is not greater than ts_start; -7 means a read failure.
vm-perfdata
VM performance metrics. Access: Cluster master can access any VM; an ordinary
user can access VMs in a VDC where they have a role with role_id ≤ 3.
Three modes:
| Mode | How to call | Returns |
|---|---|---|
| Dashboard | Only vm_id | CPU, network, disk, and RAM for the last 25 seconds |
| Chart for an interval | metric + interval | A series extending backward from the current time by interval |
| Chart for a range | metric + begin_time + end_time | A series within the specified boundaries |
| Parameter | Type | Default | Limit |
|---|---|---|---|
vm_id | Number | — | Required; minimum 1 |
metric | String | null | cpu, disk, net, ram, balloon, all |
interval | String | "1h" | One or two digits and a unit: s, m, h, d, w |
slice | String | "30s" | One or two digits and a unit: s, m, h; the grouping interval |
begin_time, end_time | Number | null | 10-digit timestamps; used only as a pair |
{
  "jsonrpc": "2.0",
  "method": "vm-perfdata",
  "params": {
    "vm_id": 42,
    "metric": "cpu",
    "interval": "1h",
    "slice": "30s"
  },
  "id": "cbf4478c-84b5-45ac-97cd-0390d7190585"
}
{
  "jsonrpc": "2.0",
  "id": "cbf4478c-84b5-45ac-97cd-0390d7190585",
  "result": {
    "code": 1,
    "data": {
      "results": [
        {
          "statement_id": 0,
          "series": [
            {
              "name": "bhyve_cpu",
              "columns": ["time", "cpu", "vm_cpus"],
              "values": [[1700000030, 5.2, 4]]
            }
          ]
        }
      ]
    }
  }
}
The metrics store response is proxied to the client without transformation;
timestamps are in epoch seconds. Errors: -4930 means no such VM; -403 means
no role in the VDC or access denied; -4907, -4911, -4912, -4915, and
-4916 mean invalid metric, interval, slice, begin_time, and end_time,
respectively; -4925 and -4923 mean metrics retrieval failed.
vm-check-configuration
Compares the running VM's configuration on the hypervisor with the authoritative configuration stored by vStack Center and returns a concise verdict. Raw hypervisor data is not sent to the client.
The privilege is Check VM Configuration (1114), scoped to the VDC. It is
assigned to the Cluster master, VDC administrator, VDC user, and VDC observer
roles; the method rejects the Resource viewer role with -403.
| Parameter | Type | Required | Description |
|---|---|---|---|
vm_id | Number | Yes | VM identifier; minimum 1 |
{
  "jsonrpc": "2.0",
  "method": "vm-check-configuration",
  "params": { "vm_id": 42 },
  "id": "cbf4478c-84b5-45ac-97cd-0390d7190585"
}
Match verdict:
{
  "jsonrpc": "2.0",
  "id": "cbf4478c-84b5-45ac-97cd-0390d7190585",
  "result": {
    "code": 1,
    "data": {
      "status": "match",
      "mismatch_count": 0,
      "meta": { "fetched_at": 1780669931 }
    }
  }
}
For a mismatch, status is mismatch, and mismatch_count shows the number
of configuration keys that differ. The key names and values themselves are
not included in the response or log.
Keep the following in mind:
- The method is asynchronous: an interim response arrives first, and the
final response is retrieved through
task. - The VM must be running. For a stopped or suspended VM, the method returns
-4941without contacting the node. - A successful result is cached for 10 seconds by VM identifier: another call within this window returns the same verdict without contacting the node. The cache is cleared after any operation that changes the VM configuration.
- Some keys are excluded from the mismatch count because they change between
hypervisor starts without changing the meaning of the configuration. These
are the prefixes
gc.,uefi.vars,pci.0.29.0.tcp, and keys ending in.password,.secret, or.key. - An agent response with more than 2000 keys is rejected as too large.
- Another call without changes returns the same
statusandmismatch_count; onlymeta.fetched_atis updated.
| Response | Meaning |
|---|---|
-403 | Missing privilege, or the VM is outside the role's scope |
-4940 | The VM does not exist or is hidden by the visibility scope |
-4941 | The VM is not running |
-4942 | The VM's node is unavailable |
-4943 | The node agent cannot return the configuration while the VM is running |
-4944 | The agent response contains too many keys |
-4945 | Internal validation error |
The validation result is recorded in the security log: an event for the
completed check is always logged, and a mismatch verdict also generates
an integrity violation event at the alert level. The violation event is
logged only for a fresh result; a cached verdict appears in the check event.
vm-inventory
Cluster VM inventory: vStack Center queries agents and compares its own data with what the nodes see. The method is asynchronous and has no parameters; an active session is sufficient.
{
  "jsonrpc": "2.0",
  "method": "vm-inventory",
  "params": {},
  "id": "cbf4478c-84b5-45ac-97cd-0390d7190585"
}
{
  "jsonrpc": "2.0",
  "id": "cbf4478c-84b5-45ac-97cd-0390d7190585",
  "result": {
    "code": 1,
    "data": {
      "discrepancy": [
        [42, null],
        [null, 99]
      ],
      "VMs": {
        "42": 3,
        "50": 1,
        "99": 5
      }
    }
  }
}
How to read the response: discrepancy contains pairs in the form "vStack Center
side — node side". The pair [42, null] means VM 42 is recorded in the cluster,
but no agent sees it; [null, 99] means the reverse. An empty array means
there are no discrepancies. VMs is a VM-identifier-to-status map based on
agent data. Service VMs with identifiers below 30 are excluded.
The mode depends on the cluster setting: when querying by pool, the response
contains discrepancy and VMs; when querying by node, these fields are absent.
Errors: -200 means node states could not be retrieved; -78 means a read failure.
See also
- Virtual machine lifecycle — what the statuses
and the
hw_version,nvme, andlockedattributes mean - How to create, delete, and move a virtual machine — OS profile reference
- How to manage VM disks and compute resources — boot media reference