How to read the log and filter events
When to use this
When you need to understand what happened in the cluster: who signed in and when, which sign-in attempts failed, and what changed in roles and settings. This is also the starting point for investigating an incident — first select events by time and category, then examine an individual record in full.
Everything described below is on one screen — Security Event Log. It contains the event table, filter panel, individual record card, and email notification settings for critical events.
This procedure does not cover file exports or hash chain verification: see How to export the log, download an archive, and verify integrity. The event and severity model is described in Security log.
Prerequisites
- a global cluster-level role — Cluster master or Security Admin;
reading events requires
ViewSecurityLog, marking them as read requiresAcknowledgeSecurityEvent, and editing email settings requiresEditSecurityNotifySettings(Cluster master only); - vStack Center version — 3.0.3.
Buttons and menu items for which you lack the required privilege are not displayed. A missing button means insufficient permissions.
Steps
Step 1. Open the log
- Open Sites → the required cluster.
- In the navigation tree on the left, select Security Event Log. The breadcrumb path is Sites → cluster → Security Event Log.
- Stay on the Current events tab — these are the events in the log table. The Archived events tab shows archive files; working with them is covered in a separate procedure.
Step 2. Read the table
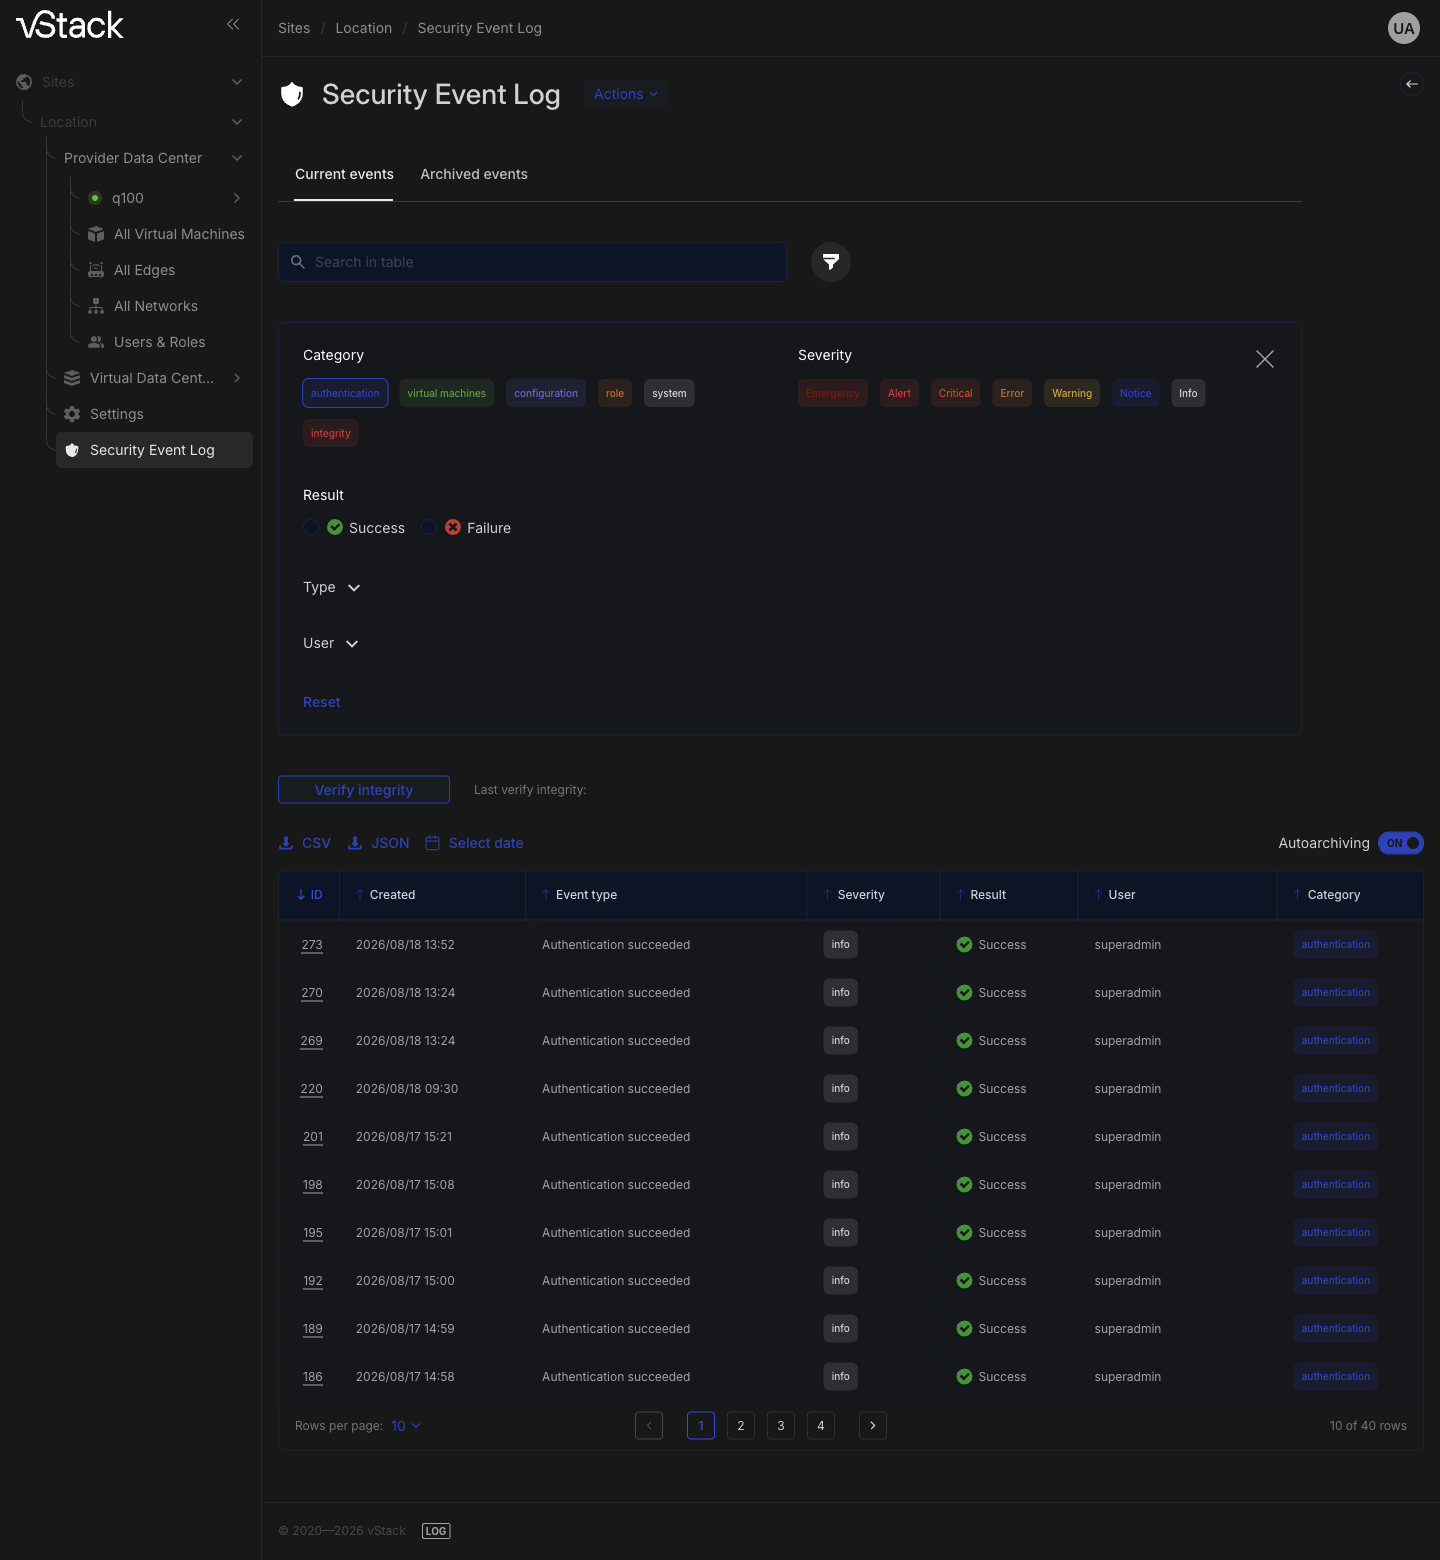
The table on the Current events tab has the columns ID, Created, Event type, Severity, Result, User, Category — record ID, time, type, severity, result, user, and category. Above the table is Search in table; below it is pagination with a page size selector (10, 25, or 50 records).
Read three columns together. Severity separates critical events from
background activity, Result with the value Failure identifies failed
actions, and User answers "who performed this action?" Unread events at
the top three severity levels have highlighted rows — you can see them while
browsing without searching.
Search in table searches the displayed page by ID, time, type, severity, category, and user. It does not replace filters — to narrow the entire log rather than just the page, go to step 3.
Step 3. Narrow the selection with filters and a time range
The funnel button to the right of the search opens the filter panel. It has five fields:
| Field | What you select |
|---|---|
| Category | event area: authentication, virtual machines, configuration, role, system, integrity |
| Severity | severity level: emergency, alert, critical, error, warning, notice, info |
| Result | result: Success or Failure |
| Type | a specific event type from the list maintained by the cluster |
| User | the user who performed the action, from the cluster's user list |
The panel shows interface labels, while the record and export use short codes
for the same categories: authentication is auth, virtual machines is vm,
and configuration is config; role, system, and integrity are the same.
The result in the record is success or failure. Severity matches the label.
This matters when reading CSV and JSON: filter the export by codes rather than
by the panel labels.
Category, severity, and result each allow one selected value: clicking the selected value again clears the filter. Type and user are selected from lists; the selected value appears below the field and can be removed with the X. Reset clears all five filters at once.
The time range is set separately with Select date above the table. It opens a calendar for selecting a period; the selected period narrows the table along with the panel filters.
The list refreshes immediately after each change; no confirmation is needed. The counter below the table shows how many records are on the page and how many are in the entire selection.
Step 4. Open an individual record in full
Click the record ID in the ID column to open the Additional Information card. It contains fields that are absent from the table columns:
| Card field | What it shows |
|---|---|
| Object name, Object type, Object ID | the object on which the action was performed; a dash for an event without an object |
| Details | additional information about the event |
| Remote IP | client address |
| Event UUID | event UUID |
| Request ID | UUID of the cluster request that generated the record |
| Record Hash | SHA-256 record hash — a link in the chain |
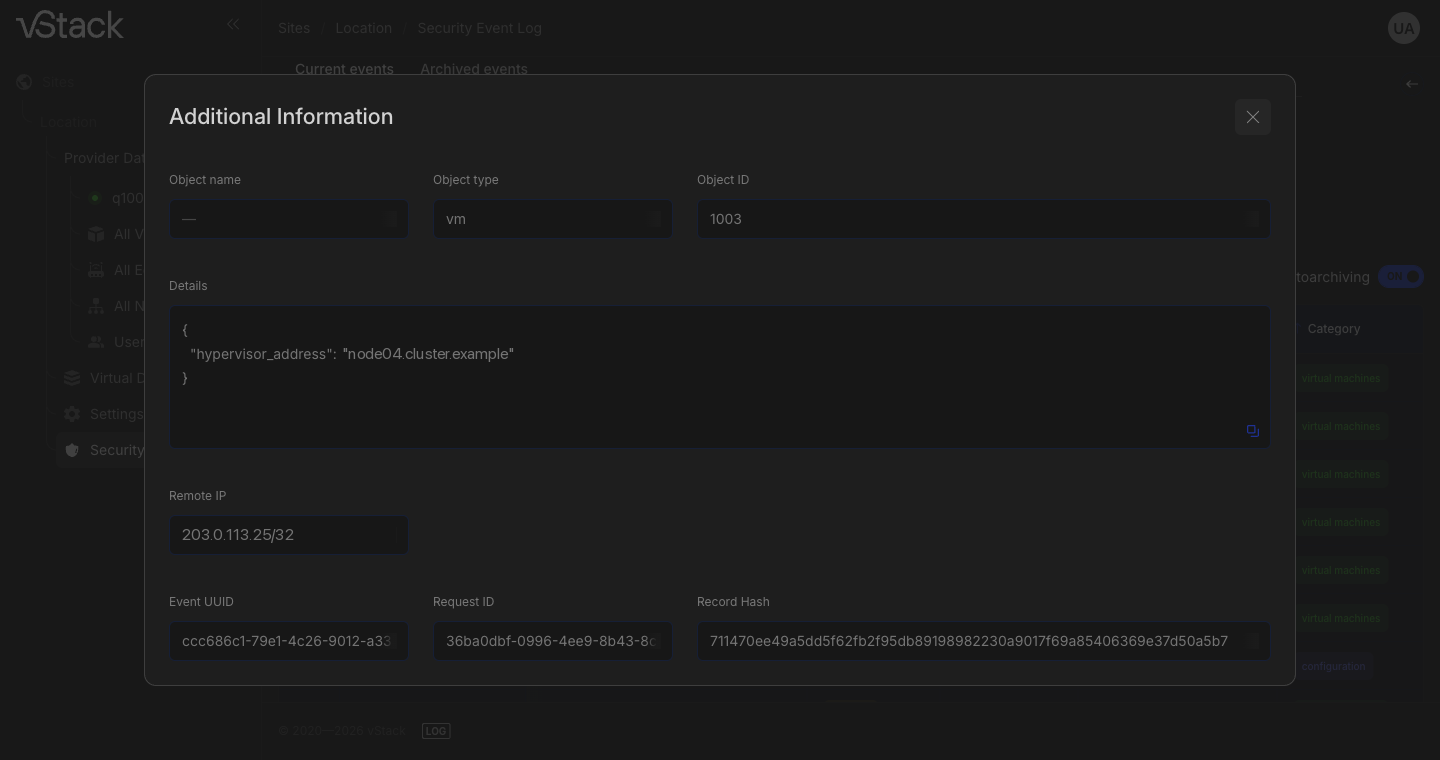
Continue the investigation using Request ID. This ID links the event to the request that generated it: if one action produced several records, they will share the same Request ID.
Step 5. Address critical events
While you have unread critical events — at the top three severity levels — the header shows the critical event indicator with their count. Clicking the indicator opens the log filtered to these three levels.
The cluster reports a new critical event through a pop-up notification: clicking it opens the card for the most recent record.
Mark reviewed events as read with Mark all as read above the table — it clears the header indicator and removes row highlighting. The button appears only when there are unread critical events.
The read mark is personal. It answers "has the current user reviewed this event?" rather than "has the team investigated it?": the same event remains unread for another administrator.
Step 6. Configure emails for critical events
- Click Actions above the table and select Notification settings.
- Turn on the Enable email notifications toggle.
- In Recipients, enter a recipient's address and press Enter — the address appears in the list below the field. Add multiple addresses this way; remove unwanted ones with the X.
- In Minimum severity for email, select the severity threshold. Events below the threshold do not generate emails.
- Click Save.
Save remains disabled while the address fails validation or nothing in the form has changed. After saving, the message "Notification settings updated" appears.
Only the Cluster master role can edit email settings. Security Admin can view the settings but cannot save them.
The emails themselves are sent by the vStack Center dispatcher through an SMTP
server whose address is set on the management VM, not in this form. Until the
server is set, no emails go out, even though the settings save without errors.
The default threshold is alert: with it, emails arrive only for integrity
violations. Server setup, threshold choice, and the delivery check are covered
in How to set up security log email notifications.
Verify the result
Compare the table and card for the same event. Take an ID from the ID column, open the card, and confirm that it refers to the same event: Event UUID and Record Hash are populated, and all records from one action have a Request ID.
Check the filter: select Category — authentication and Result — Failure;
only failed sign-in attempts should remain in the table. Reset should
restore the full list.
Check the read mark: after Mark all as read, the critical event indicator disappears from the header, row highlighting is removed, and the button itself disappears until the next critical event.
Troubleshooting
The record card does not open, event not found (-11202). A record with
this ID is no longer in the log table — autoarchiving moved it to an archive.
Workaround — look for the event in the archive files on the Archived events
tab.
The list did not load, database error (-24000). The cluster could not
read the log. No data is lost: refresh the page; if the failure persists, check
the state of the vStack Center database.
The selection has too many records to browse comfortably. Narrow it with filters and a time range rather than the page size: Search in table works only on the displayed page and does not provide the full picture.
Email settings are not saved (-24007). A value failed validation:
the recipient address was entered incorrectly, or Enter was not pressed
and the address was not added to the list. Check the addresses in the list
below the field and try saving again — existing saved settings do not change
when saving fails.
The Actions menu has no Notification settings item. The role lacks the privilege for email settings. Only Cluster master can edit them.
The critical event indicator remains after marking events as read. The read mark is personal, and the indicator counts the current user's unread events. Check that you marked the events under the same user account you are using to view the log.
API methods
API operations covered on this page: security-event-list, security-event-get,
security-event-types, security-event-critical-count,
security-event-acknowledge, security-event-notify-settings-get,
security-event-notify-settings-set — see the
API reference.
See also
- Security log — record fields, severity levels, and the hash chain.
- How to export the log, download an archive, and verify integrity — export files, archives, and chain verification.
- How to set up security log email notifications — the SMTP server, threshold, email contents, and delivery check.
- Roles and privileges — log privileges and their scopes.