How to export the log, download an archive, and verify integrity
When to use this
When you need the log as a file: to send a selection of events to an external system, attach a selection to an incident investigation, or provide an auditor with all records for a period. This also covers working with archives — records removed from the log table by autoarchiving — and starting hash chain verification, which confirms that the log has not been altered.
Everything is done on the Security Event Log screen: exports and verification are on the Current events tab, archives are on the Archived events tab, and settings are in the Actions menu.
The three operations serve three different purposes and should not be used interchangeably.
| Task | What to click | What you get |
|---|---|---|
| A one-time selection based on filters | CSV or JSON on the Current events tab | a file in the browser's downloads; it is not stored in the cluster |
| Records from past periods | the archive size on the Archived events tab | a .csv.gz archive file from permanent storage |
| Proof that the log has not been altered | Verify integrity | a traversal of the SHA-256 hash chain and a report on the last verification |
For reading and filtering events, see How to read the log and filter events; for the log model, see Security log.
Prerequisites
- a global cluster-level role — Cluster master or Security Admin.
Privileges by operation:
ExportSecurityLog— export,ViewSecurityArchive— list archives,ExportSecurityArchive— download an archive,ViewSecurityArchiveSettings— read archive settings,VerifySecurityLog(id10002) — start verification. Editing archive settings (EditSecurityArchiveSettings, id10006) is available only to Cluster master; - vStack Center version — 3.0.3;
- access to the archive directory on the management node if you need to retrieve the file directly from there, bypassing the interface.
Steps
Step 1. Export events to a file
-
Open Sites → the required cluster → Security Event Log in the navigation tree on the left.
-
Stay on the Current events tab.
-
Narrow the selection: set the time range with Select date and, if needed, set filters in the funnel panel. The export uses the same filters and time range as the table you see.
-
Click CSV or JSON above the table for the required format. A spinner appears on the button while the file is being created.
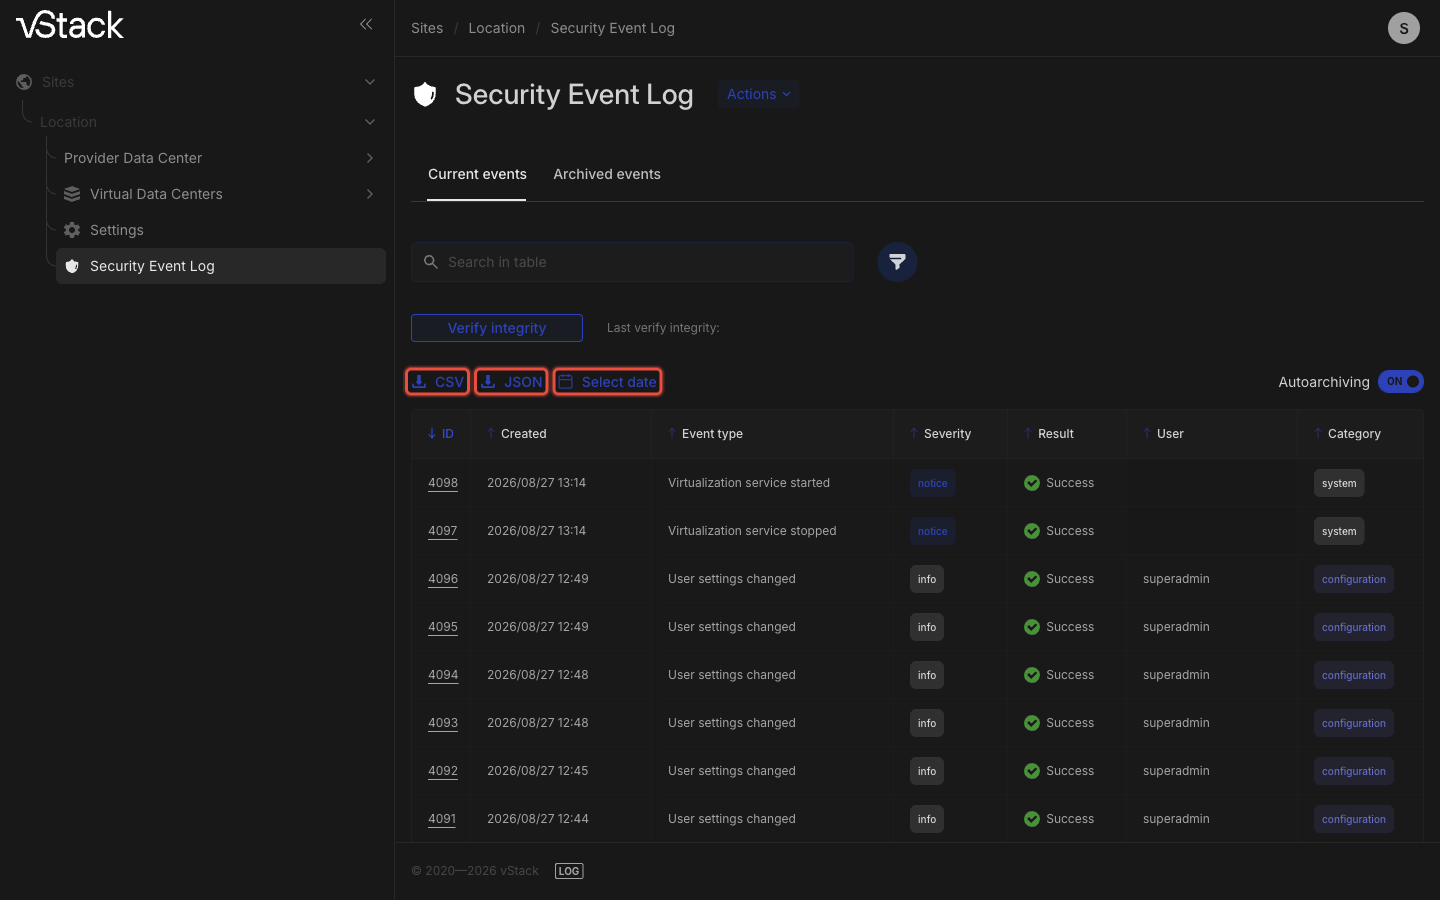
The cluster sends the completed file to the browser, which saves it to downloads. The file does not remain in the cluster: to retrieve the same selection again, repeat the export.
A single export is limited to 100 000 records. If more records match the filters, the interface does not create a file; it reports the number of records in the selection and asks you to narrow the filters.
Step 2. View the archive list
Autoarchiving moves old log records into compressed CSV files. The Archived events tab displays them.
| Column | What it shows |
|---|---|
| Period | the period covered by the archive |
| Records | the number of records in the archive |
| Size | file size; this value is also the download button |
| Checksum | SHA-256 checksum; the cell shows the beginning of the checksum, while the tooltip shows the full value and lets you copy it |
| Created | when the archive was created |
An archive still being created also appears in the list, but without a record count, checksum, or time; a spinner appears in place of the size. It is too early to download this file.
Search in table searches all five columns — it is useful for finding an archive for a specific period.
Step 3. Download and check the archive
Click the file size in the Size column — the cluster checks the checksum and sends the file to the browser. Before downloading, copy the value from the Checksum column: this is the reference value for comparison.
Check the downloaded file on your side — its checksum and decompression:
shasum -a 256 security_log_a3f1b2c4_03_01_2025.csv.gz
gunzip -t security_log_a3f1b2c4_03_01_2025.csv.gz && echo "архив целый"
The checksum must match the value in the Checksum column. Unlike an export, an archive remains in the storage directory on the management node after download — it can be retrieved again.
Step 4. Enable or disable autoarchiving
The Autoarchiving toggle is above the table on the Current events tab. ON means old records are removed from the table; OFF disables this. The interface shows a warning next to the disabled toggle.
With autoarchiving disabled, the log table grows without removing records, and no new archives are created. Monitor free space yourself.
A message about the new autoarchiving state appears after toggling, and the event list reloads.
Step 5. Adjust archive settings
- Click Actions above the table and select Archive settings.
- Fill in the form fields:
| Field | What it controls | Limits |
|---|---|---|
| Max log size (MB) | log table size threshold that triggers removal of old records | from 10 MB to 16 GB, that is, from 10 to 16384 |
| Disk space alert threshold (MB) | free space threshold below which the cluster issues a warning | at least 100 |
| Archive path | archive storage directory | length 1–256 characters |
- Click Save.
Both sizes are specified in megabytes — the form converts them to the cluster's units. Save remains disabled while nothing in the form has changed or a value has failed validation. After saving, the message "Archive settings updated" appears.
The Archive settings item in the Actions menu is available only to Cluster master: Security Admin can view the settings but cannot change them.
Step 6. Start hash chain verification
- On the Current events tab, click Verify integrity above the table.
- In the confirmation dialog, read that SHA-256 hash chain verification will run for the entire log, then click Start. To decline, click Cancel.
Verification runs in the background: the cluster splits the log into parts and checks them concurrently. While it runs, Verify integrity shows the completion percentage and does not accept another click — only one verification runs in the cluster at a time. You do not need to keep the screen open: the result remains in the last verification report.
Step 7. Read the verification result
When verification finishes, the message "Integrity verification completed" appears, and the Last verify integrity report appears beside the button — the time and result of the last verification.
| What the report shows | Meaning |
|---|---|
| a green mark and a record count | the chain is intact; all log records were checked |
| a red mark and a record ID | the chain is broken at this record; clicking the ID opens its card |
| an icon with the tooltip "Verification failed" | verification did not finish; run it again |
When the chain is broken, start the investigation with the record whose ID appears in the report: the log is consistent up to that record, and the link breaks there.
Verify the result
Export: the file appears in the browser's downloads and opens, and its row count matches the record counter below the table.
Archive: the downloaded file's checksum matches the Checksum column, and
gunzip -t completes without errors.
Chain verification: Verify integrity no longer shows a percentage, and Last verify integrity shows the time, a green mark, and the number of records checked. A red mark with a record ID means the opposite — the chain is broken.
Troubleshooting
Export does not start: the selection exceeds 100 000 records. The interface
reports how many records are in the selection and asks you to narrow the
filters. Workaround — narrow the time range or category and retrieve the log in
parts; use archives for older periods. The cluster enforces the same limit on
requests made outside the interface — rejection -24001.
The export file was not created, write error (-24002). The file could not
be written on the management node; a common cause is insufficient free space.
Check the node's free space and Disk space alert threshold (MB) in the
archive settings.
The archive did not download: file not found (-24003). The archive list
is outdated — the file has already been removed from the storage directory.
Workaround — refresh the Archived events tab and download the archive from
the updated list.
The archive is not served: checksum mismatch (-24004). The cluster checks
SHA-256 before serving the file and refused to send it: the archive on disk is
corrupted. Such a file cannot be "repaired" — export the required period from
the log table if the records are still there, and investigate the storage media.
The archive size cannot be clicked; a spinner appears instead (-24008).
The archive is still being created: it has no record count, checksum, or
creation time. Workaround — wait until these fields appear, then retry the
download.
Archive settings are not saved (-24006, -24007). A value is outside the
limits: the log size is outside the range from 10 to 16384 MB, the free
space threshold is below 100 MB, or the path is too long. Workaround — check
the limits table in step 5. Save remains disabled until the value is
corrected.
The Verify integrity button cannot be clicked (-11201). Chain verification
is already running, and the cluster will not start a second one. Workaround —
wait for it to finish: the percentage on the button shows progress.
The Actions menu has no Archive settings item. The role lacks the privilege to edit archive settings — only Cluster master can do this.
The downloaded .csv.gz file cannot be decompressed, and its size exceeds
the value in the Size column. This is a separate issue — archive corruption
during download through the interface. Investigation and workaround:
The downloaded security log archive cannot be opened.
API methods
API operations covered on this page: security-event-export,
security-event-archive-list, security-event-archive-export,
security-event-archive-settings-get, security-event-archive-settings-set,
security-event-log-verify, security-event-log-status,
security-verification-statuses — see the
API reference.
See also
- Security log — the hash chain, verification statuses, and archive settings.
- How to read the log and filter events — filters used to create the export.
- The downloaded security log archive cannot be opened — troubleshooting a corrupted archive file.
- Roles and privileges — export, archive, and verification privileges.