How to view cluster pools
When to use
When you need to find out how many pools the cluster has, which node currently serves them, how much space remains, and whether redundancy restoration is in progress. This is also the starting point for investigating reports of "out of space" and "snapshot operation fails".
The UI displays pools from the vStack Center database. The pool table therefore opens even when a node does not respond, but shows the last captured state rather than the current state.
This procedure does not cover creating or expanding a pool — the storage layer has no such operations. The storage layer model and its limitations are described in Storage pools.
Prerequisites
- A global cluster-level role (Cluster master) — a pool is a cluster-level object, so a VDC (virtual data center) administrator cannot see pools in the UI: a pool has no owning VDC, and a single pool holds datasets from different VDCs;
- vStack Center version 3.0.3;
- Physical disk management enabled in the cluster for the pool breakdown by disk (step 5) — otherwise, the pool page has no Pool Disks section.
Steps
Step 1. Open the cluster pool table
- Open the cluster: Sites → the required cluster.
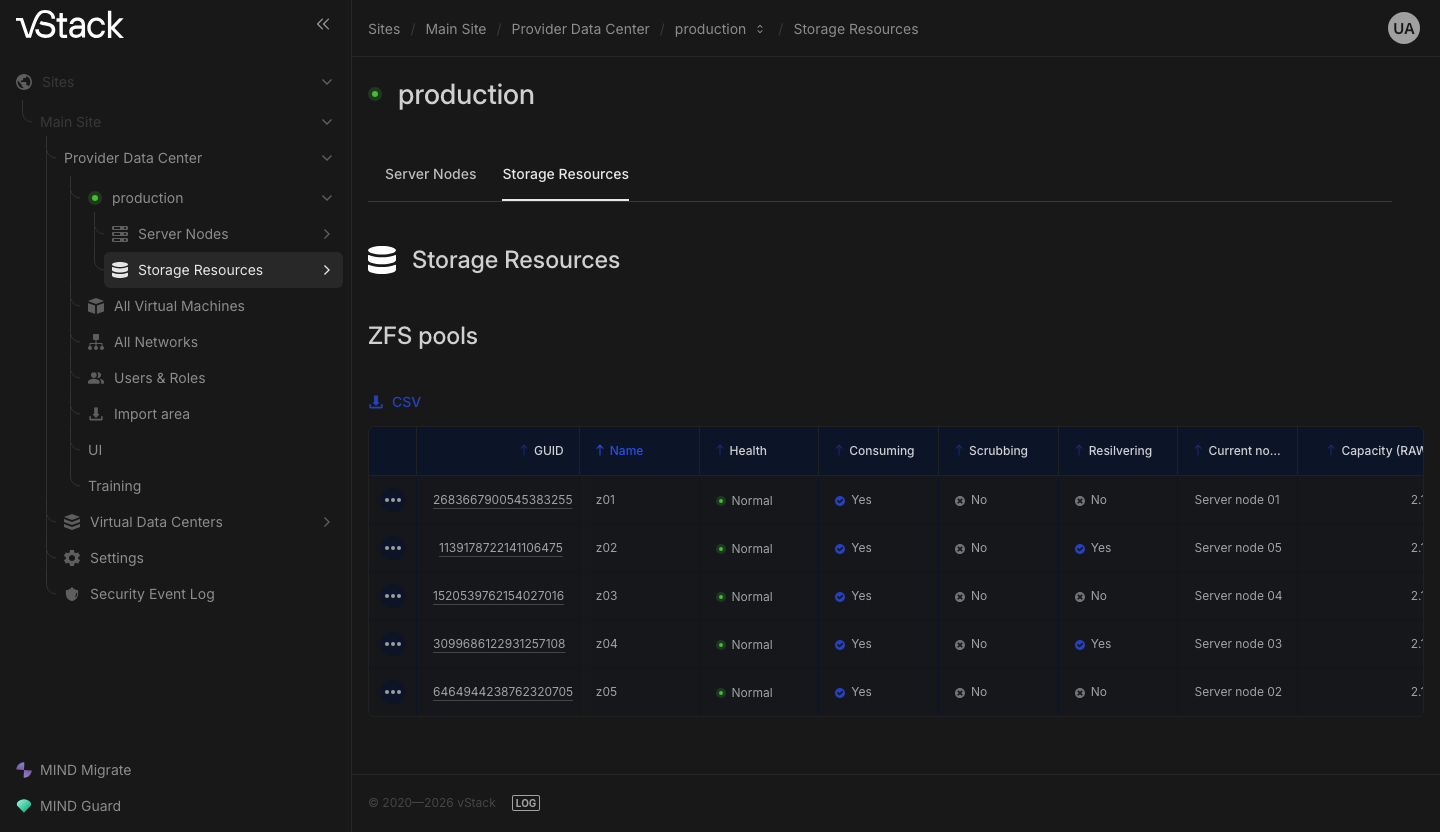
- Go to the Storage Resources tab next to Server Nodes. The same section is available in the navigation tree on the left as Storage Resources.
- Read the ZFS pools table. Columns:
GUID,Name,Health,Consuming,Scrubbing,Resilvering,Current node,Capacity (RAW). - To export the entire list, click CSV above the table.
Look for three things here. A pool with Consuming set to zero does not accept data. Snapshot
operations, creating a machine on this pool, cloning a machine, and deleting
its disk will fail. A value of one in Resilvering means that the pool is restoring redundancy
after disk replacement. A value of one in Scrubbing means an integrity check is in progress.
Two columns are misinterpreted more often than the others. Capacity (RAW) shows the pool's raw
capacity and usage percentage; usable capacity is lower than raw capacity by the portion allocated to
redundancy. Current node is the node currently serving the pool, not the node containing its
disks: disks in a single pool are installed in different nodes.
Step 2. Open the pool page
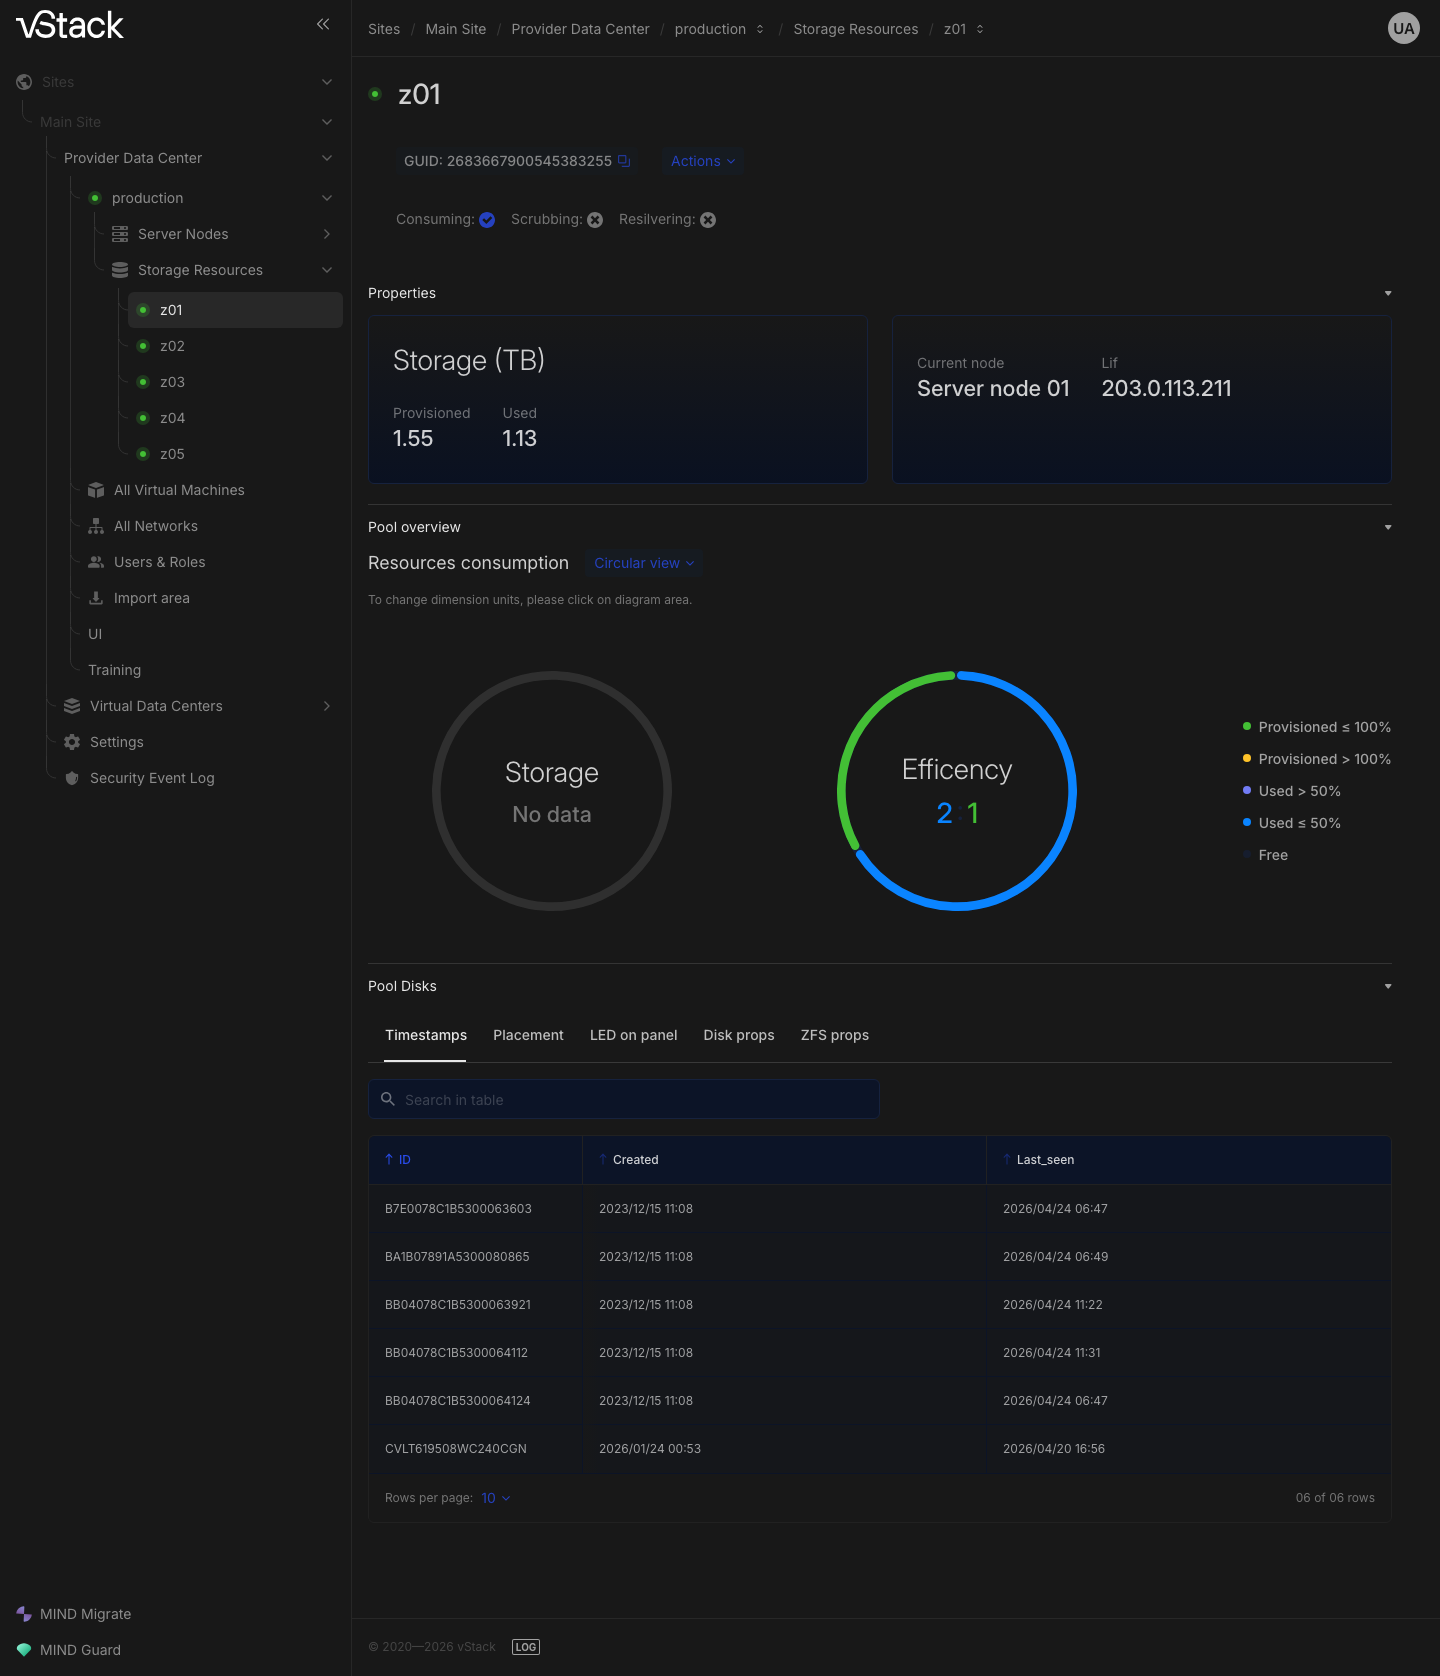
Open a pool from the table or select it by name in the navigation tree on the left — cluster pools are listed there under Storage Resources. The page heading is the pool name, with a button showing its GUID next to it.
The page contains Properties, Pool overview, and Pool Disks sections. The Actions menu groups pool operations — Start pool, Stop pool, Suspend pool, Resume pool, Transfer pool. These are operations at a different level, and this procedure does not cover them.
Step 3. Read capacity and efficiency in Properties
The Properties section groups the pool's numbers into blocks.
| Block | What it shows |
|---|---|
| Storage (TB) | Capacity — pool capacity, Provisioned — the sum of requested dataset sizes, Used — space used by data, Free — remaining space |
| Efficiency factor | Compression and Deduplication — the gains from compression and deduplication |
| Disks | Quantity — the number of disks in the pool, Size (GB) — their size, Redundancy — redundancy |
| Node and address | Current node — the node serving the pool, VIF — the network address at which the pool is accessible |
Datasets use thin provisioning: the requested volume size is not reserved immediately. Thus, Provisioned is calculated from requested sizes, while Used reflects actual usage, and the first number can readily exceed the second. If Provisioned exceeds Capacity, the pool's datasets have requested more space than the pool's usable capacity. This is not an emergency in itself, but from this point on, monitor pool usage using the usage percentage rather than remaining quotas.
Step 4. View capacity distribution in Pool overview
The Pool overview section charts pool resource consumption. The Circular view toggle changes the chart view; measurement units can be changed in the section settings.
Step 5. Examine the pool by disk
The Pool Disks section breaks the pool down by disk, with tabs to switch views. A search field (Search in table) is available above the table.
| Tab | Table contents |
|---|---|
| Timestamps | ID, Created, Last_seen — when the disk was detected in the pool |
| Placement | ID, Node Id, Enclosure_device, Enclosure_id, Dev_index, Device — physical placement |
| LED on panel | ID, Led_fault, Led_locate — enclosure indicators |
| Disk props | ID, Model, Size (GB), Status — disk model and state |
| ZFS props | ID, Pool name, Vdev_pool_name, Vdev_guid, Vdev_pool_guid — pool and vdev associations |
The Placement tab tells you which physical disk to remove; LED on
panel tells you how to illuminate it before replacement. The Node Id column in Placement
shows the node for each disk.
Verify the result
Compare the table and page for a single pool. Select a row in ZFS pools and open that pool.
Expected result: the GUID in the page heading matches the row's GUID column, the
Current node value in Properties matches the Current node column, a healthy
pool has Health set to ONLINE, an active pool has Consuming set to one, and Scrubbing and
Resilvering are zero.
Troubleshooting
Storage Resources is missing, and pools are not visible. A global cluster-level role is required. Pools are not displayed for a VDC administrator role: a pool has no owning VDC. Workaround: sign in as a user with a cluster-level role.
The ZFS pools table is empty or reports a read error (-29, "Unable to obtain
pool map data"). The same response covers two cases: failure to read the map from the
vStack Center database and a cluster that does not yet have any pools. Refresh the page; if
the cluster has pools but the table is empty, check the cluster dispatcher's state.
A one-time read error (-21) does not lose data — try again.
The numbers in the UI differ from the state on the node. The pool table and page respond from the vStack Center database and show the last captured state. Refresh the page; if the discrepancy persists, check the serving node's state.
The pool page sections are empty, and disks are not displayed (-23 or -33). Live pool data
is collected from the serving node. Check Current node in the
ZFS pools table and that node's state on the Server Nodes tab: an unresponsive node returns
an error instead of pool properties.
The pool page has no Pool Disks section. The pool breakdown by disk appears only in a cluster with physical disk management enabled.
Consuming is zero, and virtual machine operations are rejected. The cluster has not
accepted the pool for active data storage, and writes to it are rejected. This
blocks creating and deleting snapshots, rolling back to a snapshot, sending a
backup, creating a machine on this pool, cloning a machine, deleting its disk, and
operations on backup datasets. Adding and expanding a disk still work
in this state. Look for the cause in the pool.
See also
- Storage pools — the model, two capacities, and state flags.
- Storage method fields and error codes — response fields and the code table.
- How to view and change dataset properties — the level below the pool.
API methods
API operations covered on this page: pool-map, pool-map-by-guid, pools-list,
pools-get — see the API reference.