How to manage cluster nodes
When to use
Take a node out of service before maintenance and return it afterward, check its hardware against the inventory list, align package versions across the cluster, and change system parameters. All these tasks are handled in one place — the node card in Server Nodes.
Keep the division of responsibilities in mind. Cluster Manager maintains cluster membership and node statuses: vStack Center only forwards commands to take a node out of service or return it to service. Inventory, software versions, and configuration come from the node agent and are stored in the database, so the last detection time indicates how current the data is. Metrics are stored in InfluxDB.
| Task | Where in the UI |
|---|---|
| Cluster membership and node state | Server Nodes, node table |
| Taking a node out of service and returning it | Node card in Server Nodes |
| Hardware inventory | Node card, Hardware section |
| Software versions | Software button on the node list and node card |
| Configuration parameters | Configure button on the node card |
| Node metrics | Node card, Perfdata section |
Prerequisites
- The Cluster master (role_id=1) role — required for all node operations and commands to take a node out of service or return it to service;
- The
feature.node_config_managementflag enabled — for starting hardware inventory collection (rejection code -23201), node configuration (rejection code -23110, and -23301 for the parameter list), and software version collection (rejection code -43201); - The
feature.hardware_inventoryflag enabled — for viewing inventory already collected (rejection code -26001) and CPU core utilization (rejection code -26101); - The
feature.physical_disc_managementflag enabled — for physical disk operations (rejection code -24201 and related codes in the same range); - The
feature.network_ports_managementflag enabled — for the Portgroup tab on the node card (rejection code -25001); the flag is disabled by default; - vStack Center version 3.0.3.
View cluster membership and node state
The node table shows cluster membership: it answers how many nodes there are and which of them are running.
- Open Provider Data Center → Server Nodes. The node table has ID, Name, Health, CPU (Cores), and RAM (GB) columns.
- Select a node in the table or switch to its tab (
node01,node02, and so on) — the node card opens with Overview, Software, Hardware, Disks, and Perfdata sections.
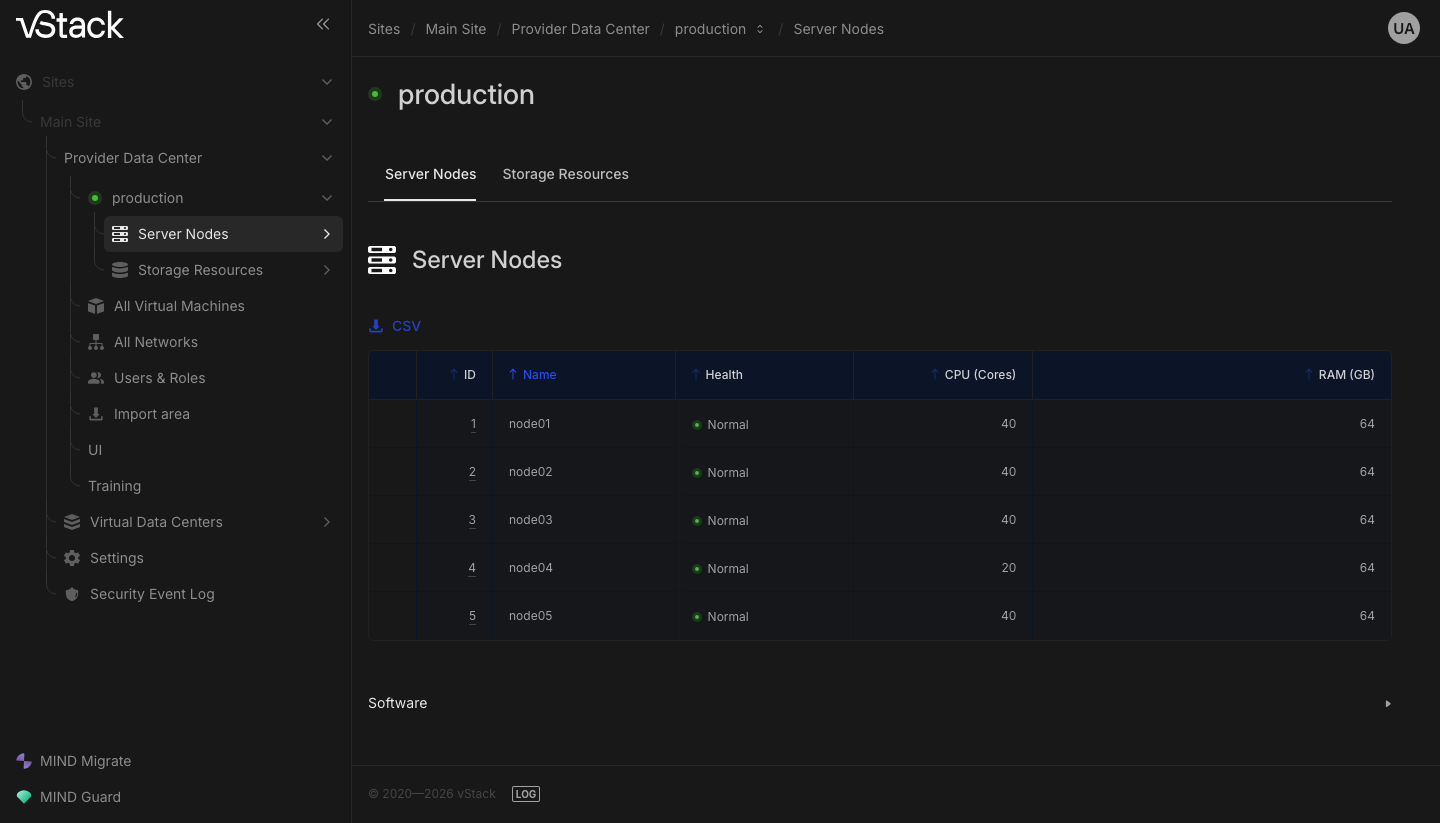
Cluster Manager determines the table contents. If the table is empty and the screen reports a status retrieval error, cluster membership data has no available source — check Cluster Manager availability.
Take a node out of service and return it
Taking a node out of service is an administrative decision. It changes permission to operate rather than terminating the node: vStack Center sends the command to Cluster Manager, and the node then stops accepting workloads. Returning it to service works in the same way.
Disabling a node affects the machines and services hosted on it. Before taking the node out of service, check Storage Resources to see which pools it currently hosts (the Current node column), and move the workloads.
- Open Server Nodes and find the node by its ID and Name columns.
- Open the node card, take the node out of service, and confirm the action.
- Verify that the decision has been received: return to the node table. The node taken out of service remains in the list but is marked as not allowed to operate.
- After maintenance, return the node to service through the same path, using the return-to-service operation.
An accepted command means that Cluster Manager received it, not that the node has already changed state. The actual change appears in the node state in the Health column, which updates when the node reports back.
The node identifier is a number. The cluster rejects a value containing other characters with code -20122 before sending the command to the nodes.
Collect hardware inventory
Inventory works in two stages. First, collection starts — vStack Center sends a command to the node agents. Then the result is displayed on the node card. There is a delay between these stages: the collection command is only forwarded to the agents and says nothing about the outcome.
Different feature flags control the stages. Collection requires
feature.node_config_management, while viewing collected data requires
feature.hardware_inventory. Therefore, "collection does not start" and "data is not
displayed" concern two different cluster options.
-
Start hardware inventory collection. You can target the entire cluster or a single node, and limit collection to a single device class.
Device class What it collects ifnetNetwork interfaces sesDisk enclosures camDisk subsystem nvmeNVMe devices smbiosSMBIOS data No class selected Full inventory -
Open the node card and expand Hardware. The Inner view tab shows node hardware in the Manufacturer / Description / Product / Serial number / Version table; the nested Node data, CPU, and RAM tabs switch the view.
-
The Portgroup tab shows node port groups with Name, Hash, Last_seen, MAC, Proto, and Status columns. The tab is controlled by
feature.network_ports_management. The flag is disabled by default, and the tab returns rejection code -25001. The Utilization tab shows CPU core utilization by NUMA domain; the data there is current, no more than ten minutes old. -
View disk placement in Disks: the Placement tab has Enclosure_device, Enclosure_id, Dev_index, and Device columns; the LED on panel tab has Led_fault and Led_locate indicators; and the Disk props and ZFS props tabs show disk and pool properties.
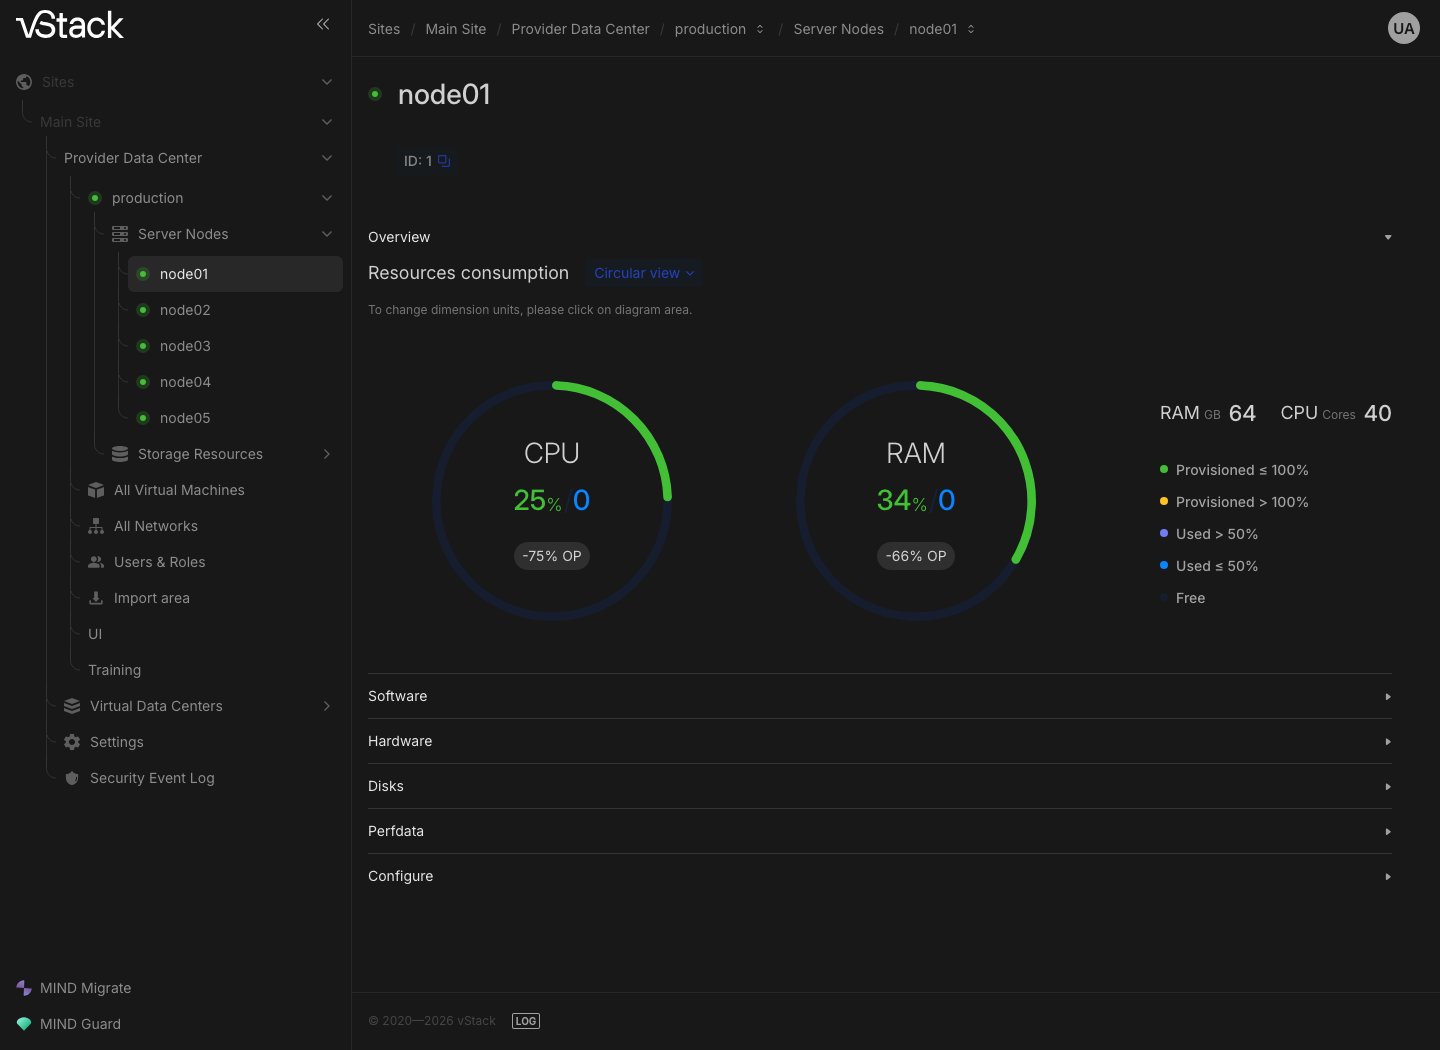
Host data collection is a separate operation: it sends a command to all nodes in the ONLINE state, collects pool and machine data from their agents, and updates the virtual machine status map. This operation is available only to the Cluster master role and is not controlled by a feature flag; if the cluster status map is unavailable, it returns code -200. Initially, the command is only forwarded to the nodes; the result appears after they respond.
Check software versions
Package versions are needed when upgrading the cluster: version mismatches between nodes are a common cause of unexpected behavior.
- Click Software on the node list or node card. The Name / Version / Last_seen table opens, showing each package's version and the time it was last detected. Node package versions and cluster versions are displayed separately.
- Check Last_seen. This column contains the time the package was last detected. An old value means that the node has not reported back for a while, and the displayed version may differ from the installed version.
- If the data is outdated, start software version collection. If no node is selected, the command is sent to all nodes in the ONLINE state. The command is only forwarded to the agents — new values appear in the table after the nodes report back.
Some packages are optional: vStack-vm-prio, vStack-storage-san, and
vStack-zpool may be absent from the table. Their absence does not indicate a collection failure.
Read and change node configuration
Node configuration is a set of parameters, each addressed by its own identifier (OID). A parameter belongs to a group and a class: the group combines related parameters (for example, VM limits), while the class defines the profile within which the value applies.
- Open the node card and click Configure. The node parameters open with current values organized by group and the last detection time of each value.
- Before editing a value, check whether the parameter is numeric or a string: this determines what the form accepts.
- Enter a new parameter value and select the class in which it should apply. You can target the change at one node or all cluster nodes at once.
- Confirm the change. The command is forwarded to the node agents, so the result is not visible immediately: reopen the parameters — the changed parameter's value and detection time will update.
vStack Center checks numeric parameters against their ranges: a value below the minimum is rejected with code -23124, and a value above the maximum with code -23125; such a value is not sent to the nodes. An unknown parameter is rejected with code -23121, a parameter that vStack Center does not support with code -23122, and a parameter without the requested class with code -23123.
View node metrics
The Perfdata section on the node card plots node metrics. Data comes from InfluxDB, so the graph contains only the metrics that have been collected.
- Open the node card and expand Perfdata. Two graphs are displayed: CPU load and memory usage.
- Select the period and interval using the controls above the graph — the defaults are a 15 m period and a 30 s interval.
- Read the legend. For the CPU graph, it contains Iowait, System, and User; for the memory graph, Active, Inactive, Wired, Buffered, and Free. The Current column shows the current value of each component.
An empty graph is not a screen error: there is no data for the node for the selected period. Shorten the period or check metrics collection for this node.
Troubleshooting
| What you see | Why | What to do |
|---|---|---|
| A node operation is rejected with code -403 "Access denied" | The operation is available only to the Cluster master role. This also applies to taking a node out of service and returning it to service | Sign in with a cluster-level role |
| Error code -20122 | The node identifier failed validation | Enter the node identifier as a number, without other characters |
| Error code -713 | The command could not be forwarded to Cluster Manager | Check Cluster Manager availability; the command did not reach the nodes |
| The node table is empty, error code -2 | Communication with Cluster Manager failed | Same action |
| Error code -23110 when reading or writing parameters, -23301 for the parameter list | The feature.node_config_management flag is disabled | Enable configuration management in cluster options and restart the cluster dispatcher |
| Error code -26001 or -26101 | The feature.hardware_inventory flag is disabled: it controls viewing node hardware and CPU core utilization | Enable the flag in cluster options and restart the cluster dispatcher |
| Error code -23201 or -43201 | The feature.node_config_management flag is disabled: it also controls starting node inventory collection and collecting software versions | Same action |
| Error code -24201 | The feature.physical_disc_management flag is disabled | Same action |
| Error code -25001 | The feature.network_ports_management flag is disabled: it controls the Portgroup tab | Same action |
| Error code -200 or -25003 | The cluster status map is unavailable; there are no available nodes to collect data from | Check Cluster Manager availability and node state |
| Error code -23203 | An invalid device class is selected | Select a class from the list above |
| Error code -23120, -23121, -23122, or -23123 | The parameter is not scalar, is unknown, is unsupported, or does not have the requested class | Check the parameter and class against what Configure displays |
| Error code -23124 or -23125 | The numeric parameter value is below the minimum or above the maximum | Set the value within the parameter's limits |
| Error code -23109 or -23133 | The configuration parameter list could not be retrieved or the command could not be forwarded to the node agent | Reopen the screen; if the error recurs, troubleshoot the control plane |
| Error code -3907, -3911, -3912, or -3914 | The metric, period, interval, or node name is invalid | Select the period and interval using the controls above the graph |
| Error code -3903 or -3904 | The metrics store did not respond or returned an HTTP error | Check InfluxDB availability |
| The command is accepted, but the data has not changed | Collection and writing run asynchronously: the command has only been forwarded to the node agent | Reopen the screen; check Last_seen to see how current the values are |
| The node is shown as running but does not accept workloads | The node has been administratively taken out of service but is still reporting back | Return the node to service if it was taken out of service by mistake |
The cluster dispatcher reads feature flags from the options once at startup and then uses that snapshot. An enabled flag does not take effect until the service is restarted. The screen returns the same rejection code.
See also
- Cluster, nodes, and services — cluster structure, the two object statuses, and feature flags.
- How to view cluster resources — cluster capacity broken down by node.
- How to manage cluster services — services associated with a node.
API methods
API operations covered on this page: node-list, cluster-node-disable,
cluster-node-enable, node-inventory, host-inventory, node-hw-list,
node-cpu-cores, node-software, node-software-inventory, portgroup-list,
node-config-map, node-config-get, node-config-set, node-perfdata — see the
API reference.